Compute shaders
Workgroups
Today I am continuing on Compute Shaders more in depth. The first thing I encountered was workgroup:
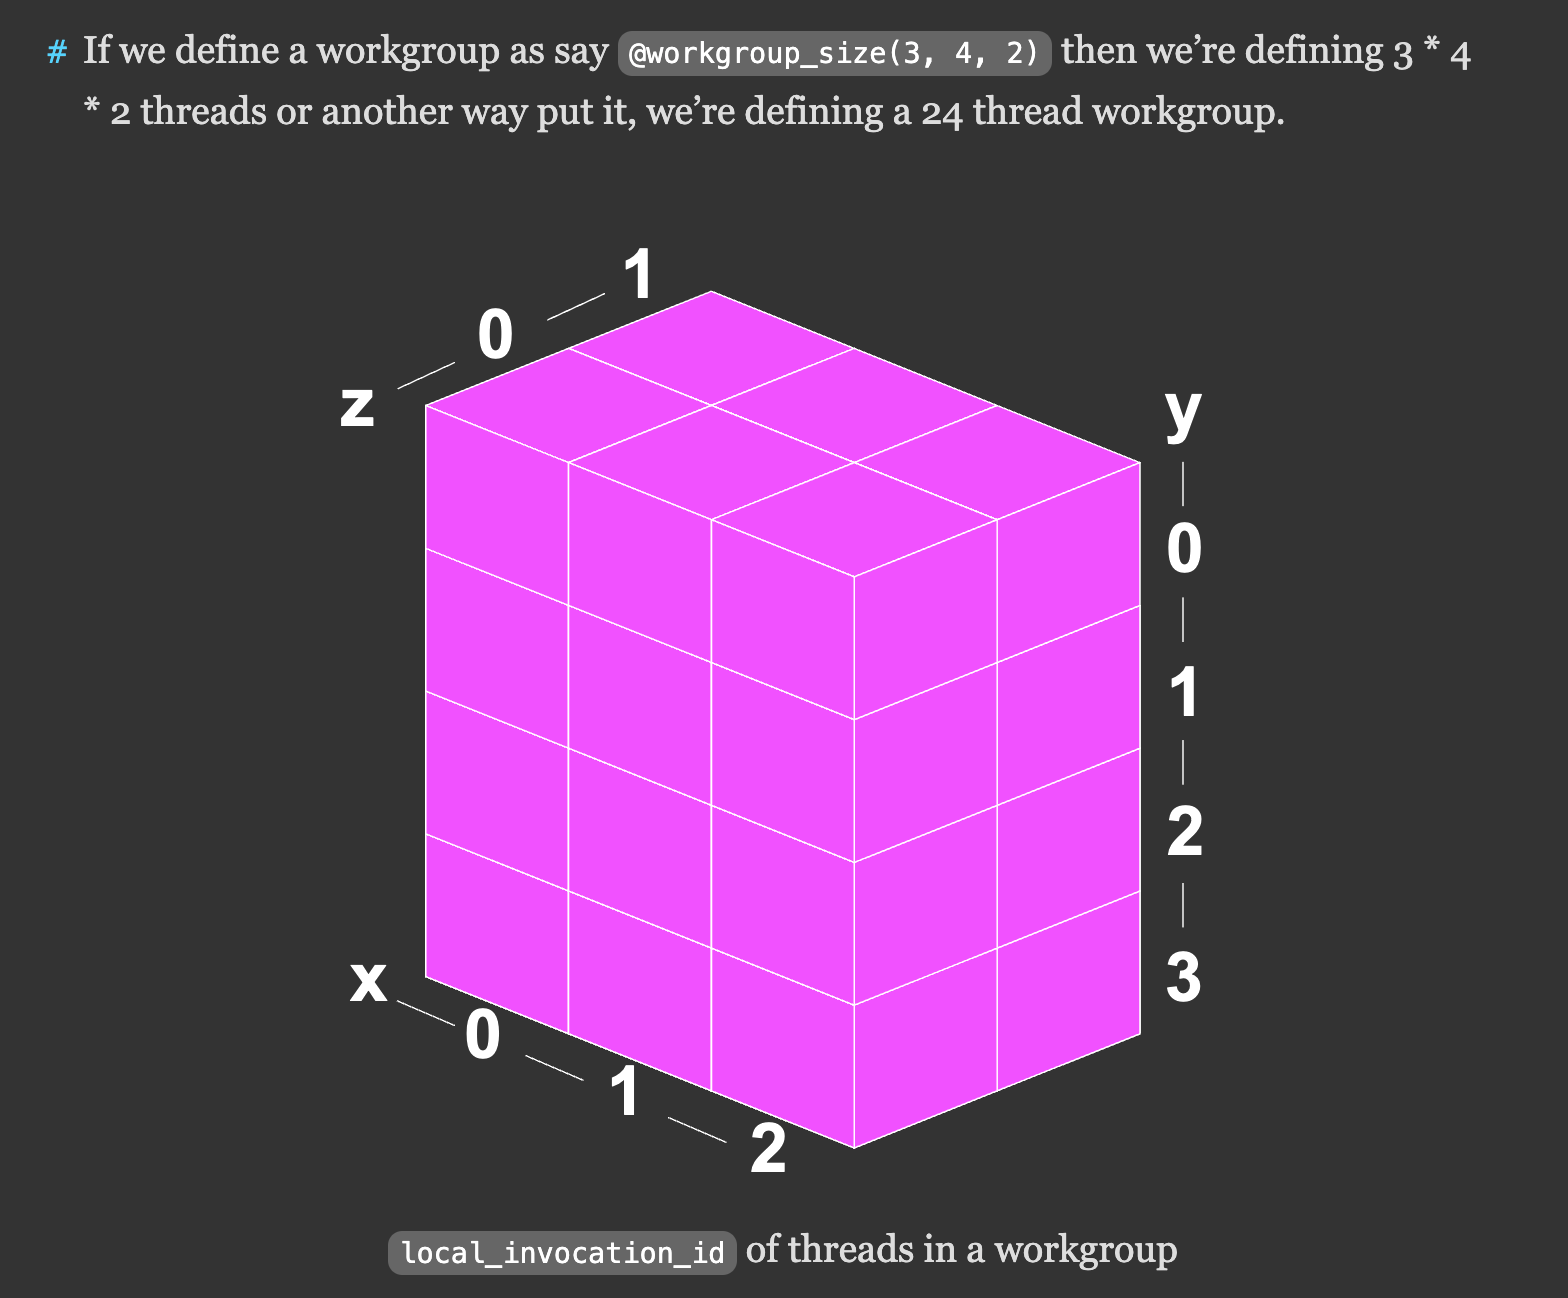
If we then call pass.dispatchWorkgroups(4, 3, 2) we’re saying, execute a workgroup of 24 threads, 4 * 3 * 2 times (24) for a total of 576 threads.
Compute shaders are better fit for GPGPU rather than GLSL with ping-pong buffers, but direct access to data buffers and organizing the computation that are used for compute shaders seems more complex at the first sight. (and at my second sight as well)
My first thought was to compare these workgroups to the textures that are used for data storage in ping-pong buffers (mostly because of the visual representation), but this is wrong comparison.
Workgroups is a way of organizing parallel computation. Data is stored in buffers, which we bind together and set to the pipeline. Textures however, actually store data.
Another important concept is decoupling from the graphics pipeline
WGSL execution model is independent of rendering. Compute shaders can work on any kind of data, not just pixels or vertices. Its outputs are stored in storage buffers or textures on GPU.
These textures and storage buffers can be then fed to fragment or vertex shaders.
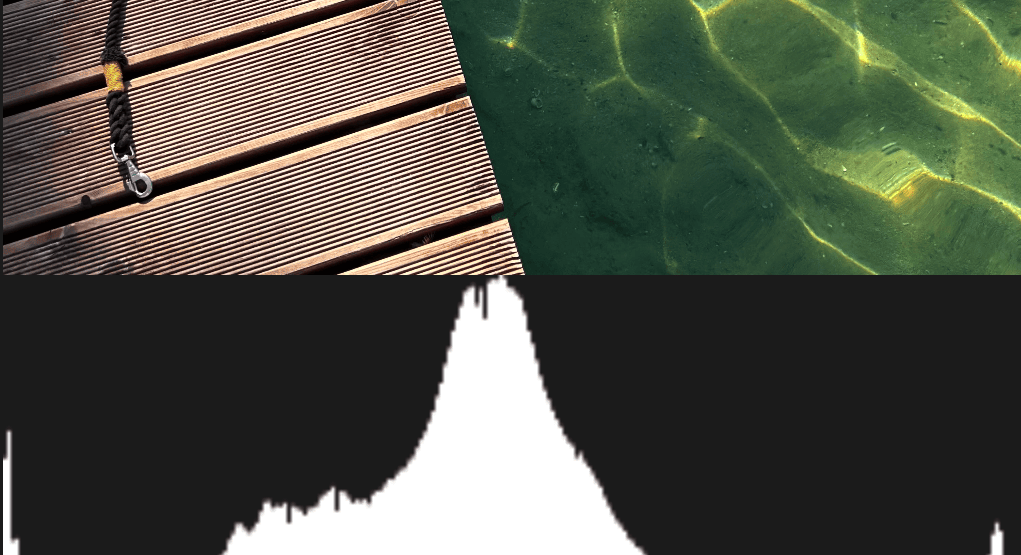
The next part of the article was coding the histogram using compute shader:
Here we loaded the image texture pixel by pixel in compute shader, counted its luminance and then saved into the histogram array, to be able to show it on another canvas:
  @group(0) @binding(0) var<storage, read_write> bins: array<u32>;
      @group(0) @binding(1) var ourTexture: texture_2d<f32>;

      // from: https://www.w3.org/WAI/GL/wiki/Relative_luminance
      const kSRGBLuminanceFactors = vec3f(0.2126, 0.7152, 0.0722);
      fn srgbLuminance(color: vec3f) -> f32 {
        return saturate(dot(color, kSRGBLuminanceFactors));
      }

      @compute @workgroup_size(1) fn cs() {
        let size = textureDimensions(ourTexture, 0);
        let numBins = f32(arrayLength(&bins));
        let lastBinIndex = u32(numBins - 1);
        for (var y = 0u; y < size.y; y++) {
          for (var x = 0u; x < size.x; x++) {
            let position = vec2u(x, y);
            let color = textureLoad(ourTexture, position, 0);
            let v = srgbLuminance(color.rgb);
            let bin = min(u32(v * numBins), lastBinIndex);
            bins[bin] += 1;
          }
        }
      }
Interesting thing is following: “Timing the results I found this is about 30x slower than the JavaScript version!!! 😱😱😱 (YMMV).” It happens because we do not use the full power of GPU in this example as we compute this pixels one by one in 1 loop. Basically just like CPU, but seven slower as one GPU is slower than CPU.
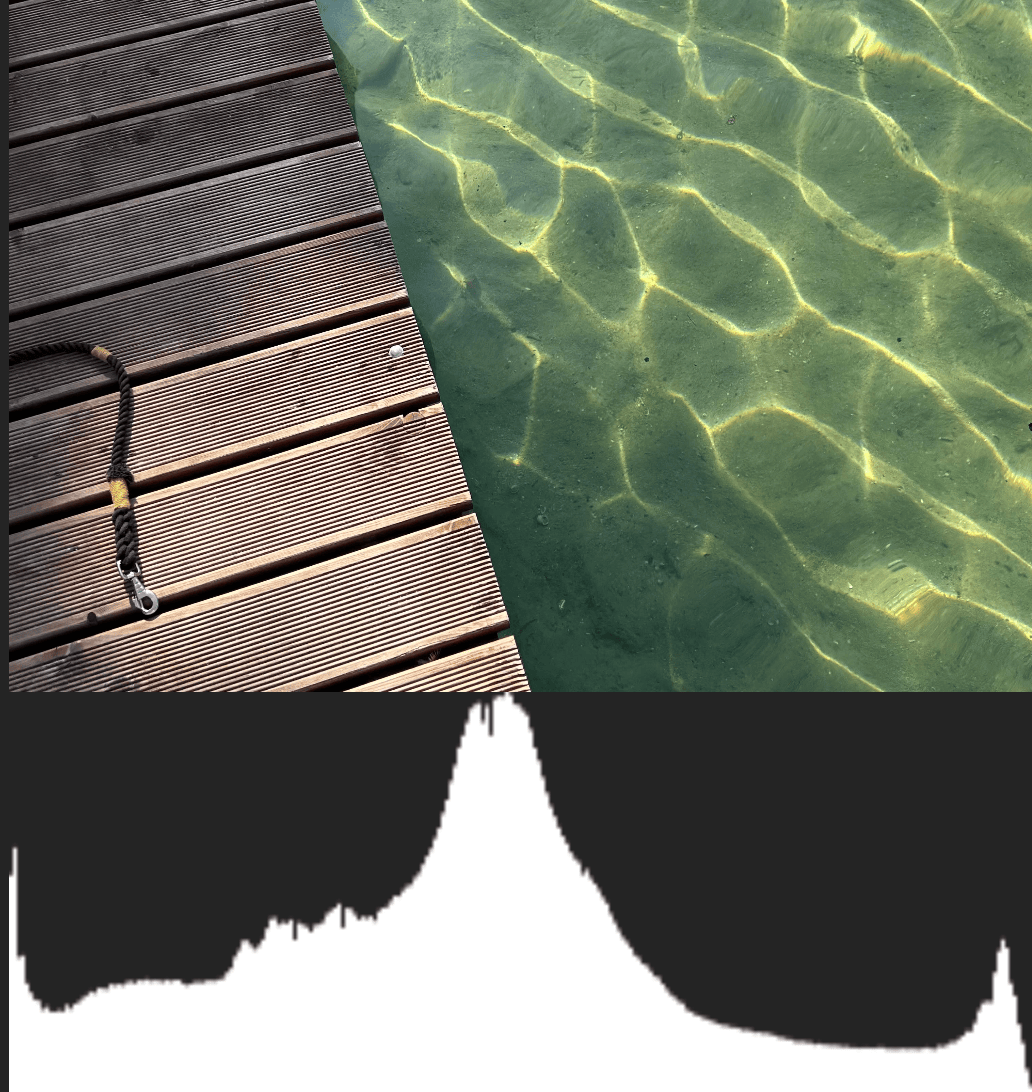
So what we can do here is to use more GPU invocations, and this is very example of using workgroups.
We changed 1 workgroup per pixel, used position as global_invocation_id.xy instead of calculating it, and passed the amount of workgroups equal to amount of pixels:
pass.dispatchWorkgroups(texture.width, texture.height).
The result was that now histograms are always a bit different every time you re-calculate them… This is actually very interesting because it’s a very clear example of race condition, and finally I am starting to understand it yay=)
Because there are so many calculations happening in parallel, some of them are taking the same value in our bins array and try to write their values into the same position. Depending on which invocation “wins”, the histogram changes all the time.
To avoid this, we can use atomicAdd.
NOTE: Atomic functions have the requirement that they only work on i32 or u32 and they require to data itself to be of type atomic.
While previous bins[bin] += 1; was calling load->add->store while executing, atomic function will execute all 3 operations at once (probably like an atom consisting of smaller particles thus the naming?).
So I’ve changed my bins to type atomic and in the shader changed adding function to this:
atomicAdd(&bins[bin], 1u);
every time it actually works I sigh in relief
But now there’s another problem –– apparently this atomicAdd blocks other invocations from adding their data to the bins.
Here is the image to see this more clear:
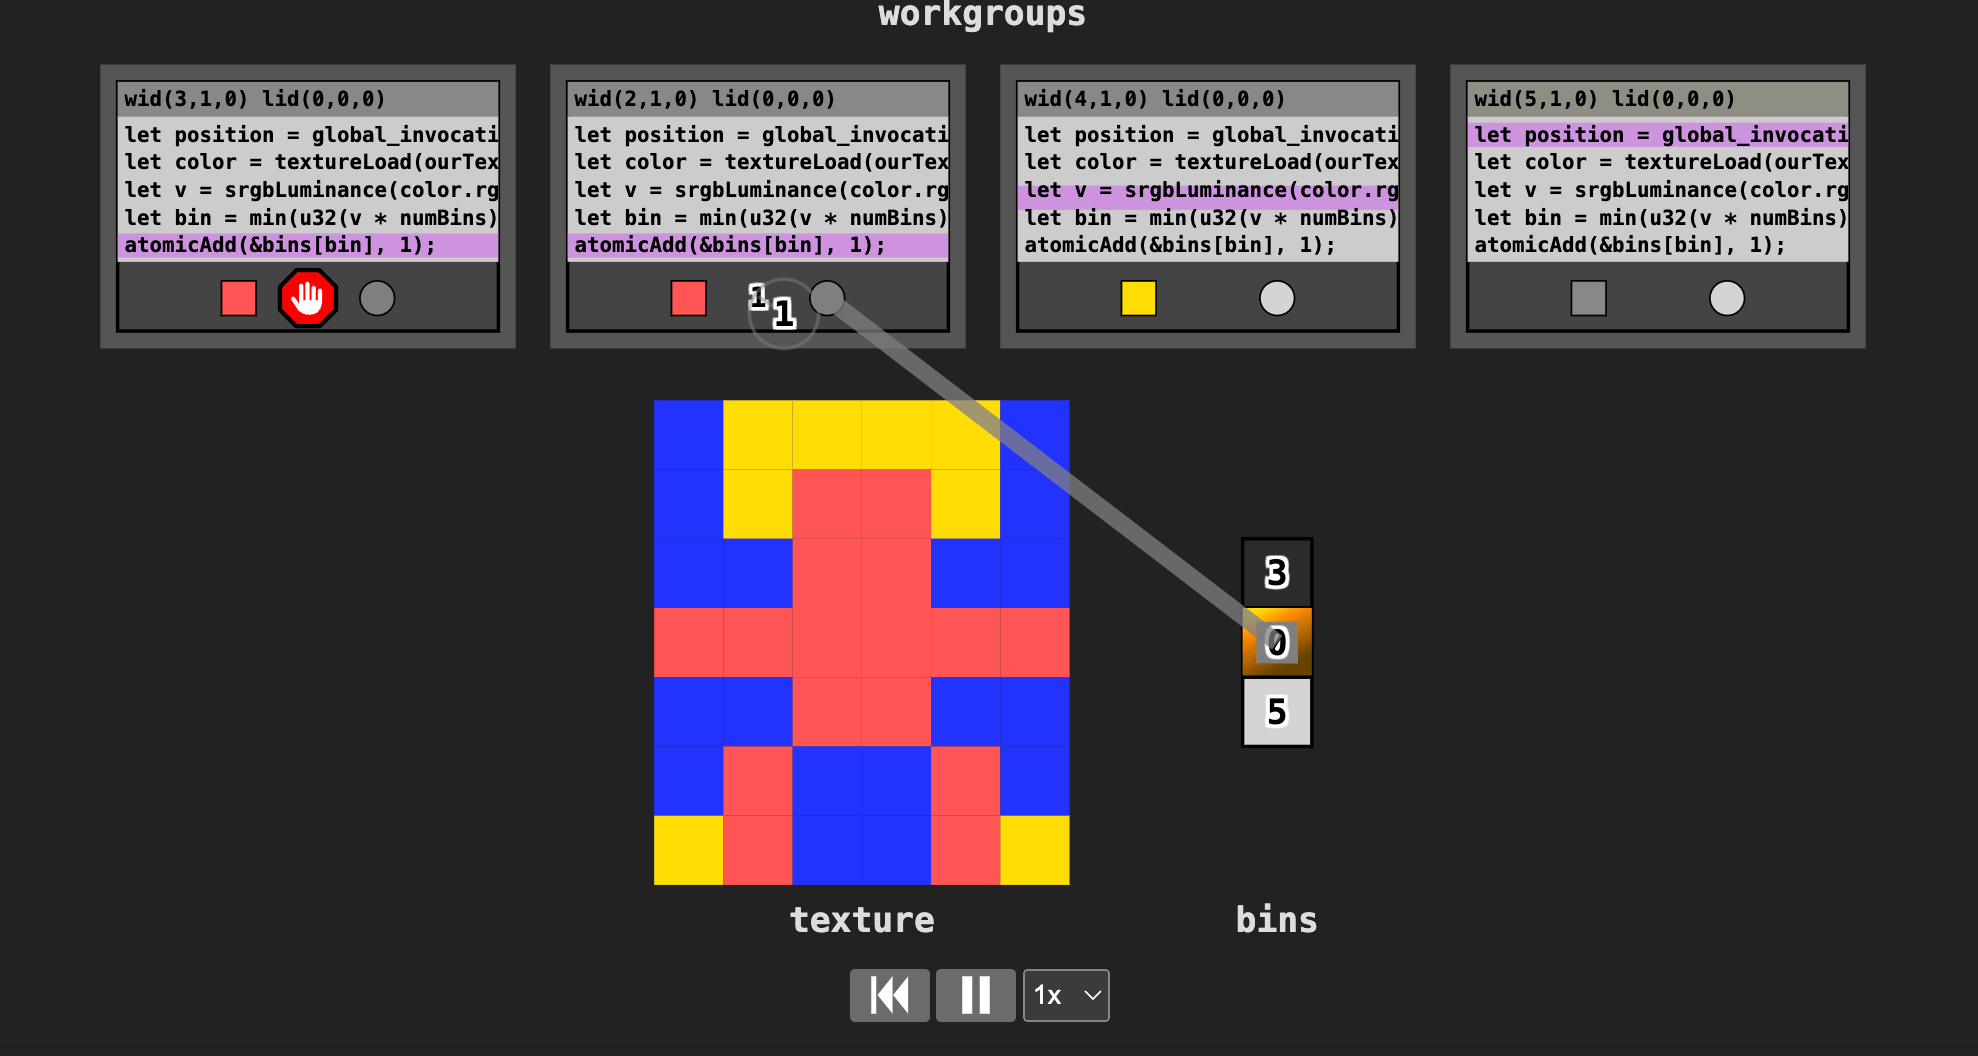 The code works fine, but it could be faster.
To achieve that, we need to break up our storage into workgroups’ storage. This way we can make our bins to be shared only with invocations in the same workgroup.
When each workgroup has chunks of their own data, we need to write a new shader to collect all this data into one place.
The code works fine, but it could be faster.
To achieve that, we need to break up our storage into workgroups’ storage. This way we can make our bins to be shared only with invocations in the same workgroup.
When each workgroup has chunks of their own data, we need to write a new shader to collect all this data into one place.
It then got interestin to the place where the setup changes to 2 pipelines for 2 compute shaders:
  const histogramChunkPipeline = device.createComputePipeline({
    label: 'histogram',
    layout: 'auto',
    compute: {
      module: histogramChunkModule,
    },
  });

  const chunkSumPipeline = device.createComputePipeline({
    label: 'chunk sum',
    layout: 'auto',
    compute: {
      module: chunkSumModule,
    },
  });
Then I have set to BindGroups:
 //BINDING ALL STORAGE BUFFERS AND TEXTURE
 // ONE BINDGROUP PER ONE PASS
    const histogramBindGroup = device.createBindGroup({
        label: 'histogram bindGroup',
        layout: histogramChunkPipeline.getBindGroupLayout(0),
        entries: [
            { binding: 0, resource: { buffer: chunksBuffer } },
            { binding: 1, resource: texture.createView() },
        ],
    });

    const sumBindGroups = [];
    const numSteps = Math.ceil(Math.log2(numChunks));
    for (let i = 0; i < numSteps; ++i) {
        const stride = 2 ** i;
        const uniformBuffer = device.createBuffer({
            size: 4,
            usage: GPUBufferUsage.UNIFORM,
            mappedAtCreation: true,
        });
        new Uint32Array(uniformBuffer.getMappedRange()).set([stride]);
        uniformBuffer.unmap();

        const chunkSumBindGroup = device.createBindGroup({
            layout: chunkSumPipeline.getBindGroupLayout(0),
            entries: [
                { binding: 0, resource: { buffer: chunksBuffer } },
                { binding: 1, resource: { buffer: uniformBuffer } },
            ],
        });
        sumBindGroups.push(chunkSumBindGroup);
    }
and then we make 2 passes to the encoder:
    //FIRST PASS
    pass.setPipeline(histogramChunkPipeline);
    pass.setBindGroup(0, histogramBindGroup);
    pass.dispatchWorkgroups(chunksAcross, chunksDown);

    //SECOND PASS
    pass.setPipeline(chunkSumPipeline);
    let chunksLeft = numChunks;
    sumBindGroups.forEach(bindGroup => {
        pass.setBindGroup(0, bindGroup);
        const dispatchCount = Math.floor(chunksLeft / 2);
        chunksLeft -= dispatchCount;
        pass.dispatchWorkgroups(dispatchCount);
    });
    pass.end();
And it works!
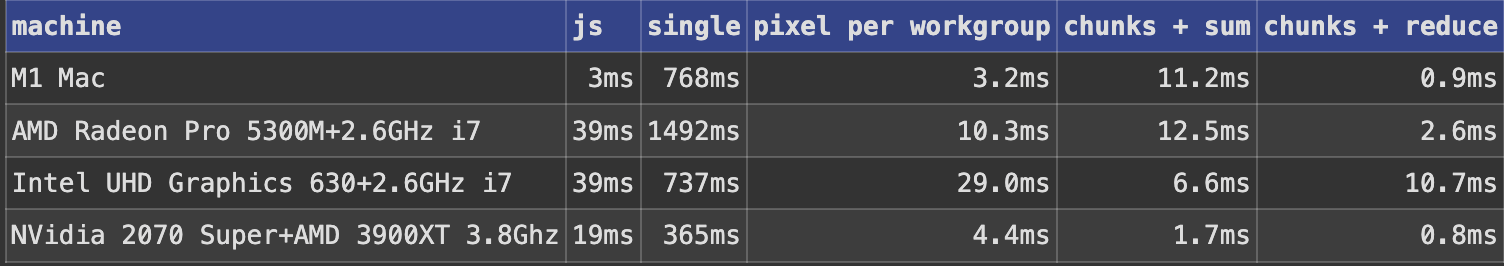
Now the speed is the most optimized, here’s a table from the article conparing all options we tried:
The thing is that while I understood pipelines and buffers much better now, there’s a new thing with breaking chunks into workgroups and also calculating the optimal subdivisions… There’s the last part to this article left, and then I will try to use it in different scenarios.